
A Gantt chart without a heavy suite
Tasks sit on the timeline as bars. You see what overlaps, what lands on a milestone, and which task is waiting for another.
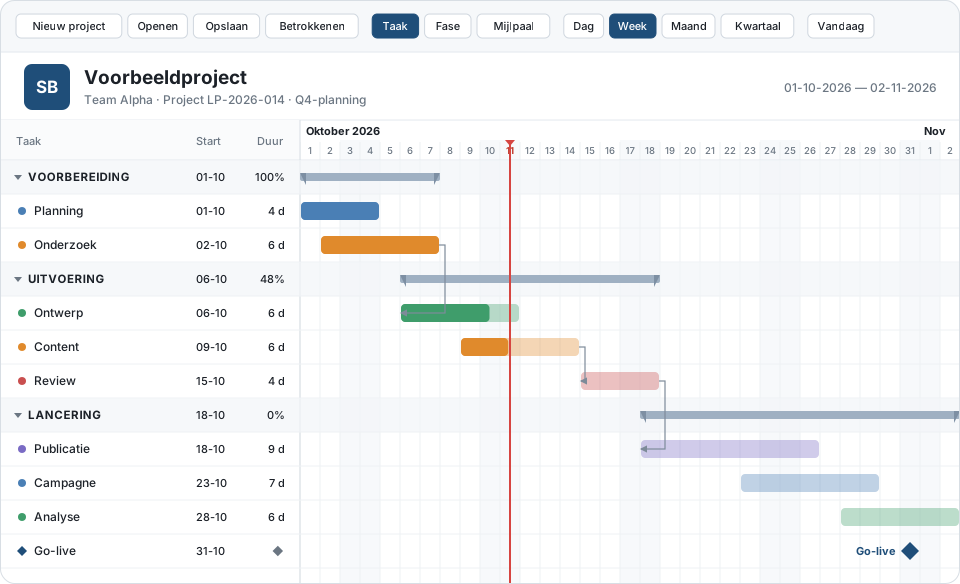
Bars, not an endless list
Each task has a start and an end. On the timeline that becomes a bar. A milestone is a moment, not a bar that runs for days.
Zoom in to plan the next few days, and zoom out to see the quarter. The line for today stays the anchor.
Dependencies and progress
Link a task to a predecessor when the work can start only after something else is finished. The percentage on a task shows how far it is.
Export to PDF or CSV happens on your own device. The demo shows the timeline before you save anything.